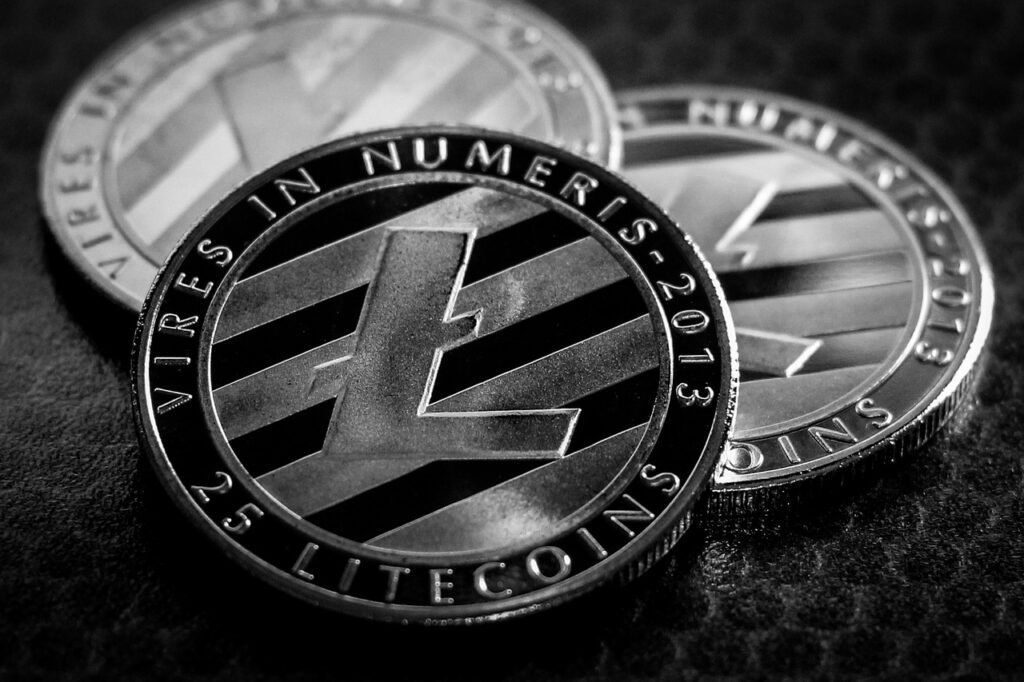
Litecoin [LTC], which is sometimes called the “silver” to Bitcoin’s “gold,” and several other cryptocurrencies all saw their prices drop over the past week.
But what makes Litcoin different from the others is that in the last 24 hours, its performance went up by more than 2%, which is a better sign of recovery.
In the last 24 hours, LTC grew even more than top cryptocurrencies like Bitcoin and Ethereum. At press time, Litecoin was trading for $54.25.
What the numbers show
Since the big market crash earlier this year, most cryptos, including LTC, have had a hard time getting their prices back up. But since July, the market has shown signs of recovery, which helped LTC reach $63 by the middle of August.
LTC’s price is now $52 because of its recent drop. Along with the price of LTC, the MVRV ratio also registered down, which is a good sign that the market may have reached its bottom. So, there is a chance that Litecoin will continue to rise in the days to come.

Those who own Litecoin can see this as a sign to take a slow long position.
Also, an interesting thing for investors was that the reserve risk of LTC went down. This gave investors a chance to buy because the risk-to-reward ratio got better.
Even though the above metrics registered down, Litecoin’s development activity shot up over the past week. This is a good sign for crypto in general because it shows that developers are interested in and working to improve the blockchain.

Moving forward
The readings from LTC’s 4-hour chart were confusing, which was interesting. Some signs showed that things would get better, but others showed that they wouldn’t.
On August 28, the MACD showed a bullish crossover because the blue line was about to cross over the red line. This showed that the price of LTC is likely to go up even more. RSI, on the other hand, was sitting at 44.55 without showing any clear bullish signs like MACD.

On the other hand, the Exponential Moving Average (EMA) ribbon showed that the market was likely to go down because the red line was far above the yellow line and the gap between them seemed to be getting bigger.
Bollinger Bands also suggested that the price of LTC might go down in the next few days. So, there was less chance of a northward breakout.


